
Page 18 - Volume 15 Number 12
P. 18
engine and that in other countries the recommendation for overhaul is way beyond the 3,600 hours required in the U.S. That being said, I think performing engine vibe surveys from time to time is a really good idea.
Vibration Detection Equipment
Vibration detection is an integral part of aviation maintenance. I learned about prop balancing very early on in my career and always had access to (or owned my own) Chadwick balancer. Today, the equipment used for vibration analysis of aircraft engines and components is the Chadwick-Helmuth 192A Vibration Analyzer or the MicroVib II Aircraft Analyzer. Both are approved for use with the MORE program and identify the various vibrations in an engine running at takeoff power. Both report the frequency (RPM) and the amplitude of the vibrations detected, expressed in “ips” (inches per second). Results are plotted on a graph and typically RPM is plotted along the horizontal axis at the bottom of the graph and ips is the vertical axis.
When I maintained King Airs with engines on the MORE program, there was one guy in town with the Chadwick-Helmuth 192A. I hired him to complete all my engine vibe surveys. The 192A analyzer is an analog device that uses cards pre-printed with a grid of RPM versus ips. It has a pen device that records the analyzer box data onto the card, similar to a seismograph.
It may sound archaic in this digital age but the 192A has surprising sensitivity and scope.The cards record
RPMs from 150 to 900,000 and ips from 0 to 10.0. The card most applicable to PT6A engines has the red border with an RPM range of 150-14,000 and ips from 0 to 3.0.
Reading the Graph
The vertical axis on the graph (ips) shows the degree of vibration. The taller the spike, the more vibration is going on. Remember, the various components have a signature RPM, so look to the horizontal axis (RPM) to identify which component is vibrating.
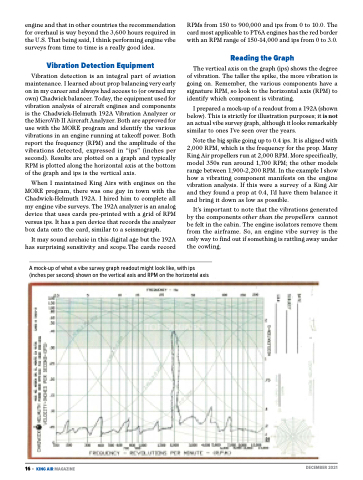
I prepared a mock-up of a readout from a 192A (shown below). This is strictly for illustration purposes; it is not an actual vibe survey graph, although it looks remarkably similar to ones I’ve seen over the years.
Note the big spike going up to 0.4 ips. It is aligned with 2,000 RPM, which is the frequency for the prop. Many King Air propellers run at 2,000 RPM. More specifically, model 350s run around 1,700 RPM; the other models range between 1,900-2,200 RPM. In the example I show how a vibrating component manifests on the engine vibration analysis. If this were a survey of a King Air and they found a prop at 0.4, I’d have them balance it and bring it down as low as possible.
It’s important to note that the vibrations generated by the components other than the propellers cannot be felt in the cabin. The engine isolators remove them from the airframe. So, an engine vibe survey is the only way to find out if something is rattling away under the cowling.
A mock-up of what a vibe survey graph readout might look like, with ips (inches per second) shown on the vertical axis and RPM on the horizontal axis
16 • KING AIR MAGAZINE
DECEMBER 2021
